


New GajaCms 2026.8 is available—new modules, performance, and integrated AI. Read the changelog
Guida di GajaCms Guida di GajaCms
PANEL

Interface Overview

The main areas

When you log into GajaCms, you are presented with an interface divided into three main areas.

  1. The environment bar: the vertical column on the left, with icons of the environments available in your project and, at the bottom, settings.
  2. The side menu: next to the environment bar, it shows the items related to the selected environment.
  3. The top bar: contains quick search, notifications, and your account menu.
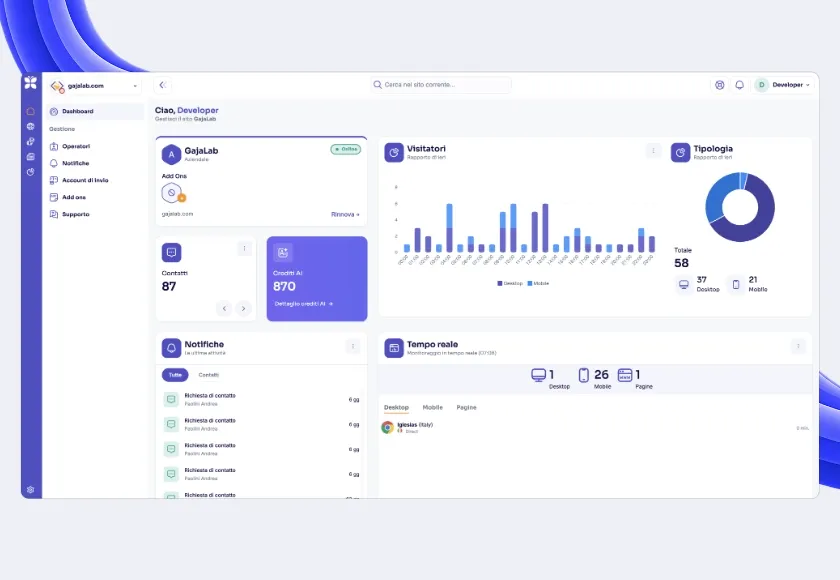
Dashboard

The main commands

Besides the three areas, the panel gathers some commands you will frequently use, distributed between the environment bar and the top bar.

  1. Settings: the gear-shaped icon at the bottom of the environment bar, below the last available environment. From here you access the general settings of the current site.
  2. Site switch: if the project has multiple sites, the selector at the top left, where the active site's domain appears, allows you to switch from one site to another without leaving the panel.
  3. Support and tickets: the icon in the top bar, next to notifications, opens support requests to those managing your project.
  4. Notifications: the bell in the top bar signals updates related to your activity.
  5. Account: the menu with your name, at the top right, from which you access your profile and account options, including logout.
Dashboard

A flashing orange dot on the notifications or support button indicates the presence of an unread notification or a response to a support request. A red dot on the settings button requires entering essential parameters for the proper functioning of the current website.